EN
 Siehe
Siehe
Siehe
WEBINAR - Release
Imagicle Voice Virtual Agents. Introducing human-like AI in your customer service. (EMEAR)
 Siehe
Siehe

 Download
 Luca Campo dall’Orto - 17 Oktober, 2023 - 7 ’ read
Hey there, Imagicle friends! Summer is over, and we are all back at work. Wouldn’t it be amazing if we could have a second summer? Imagine all the exciting news we could share about reporting for Webex Calling Multi-Tenant!
Well, guess what? I’m Luca, part of Imagicle’s awesome R&D team, and I can’t wait to show you some fascinating insights into analyzing Webex Calling calls through our new Call Analytics reports. Let’s dive in!
I know what you’re thinking. Control Hub already has a built-in reporting tool. So, why should you care about a dedicated Imagicle app to do the job?
Well, the reasons are many.
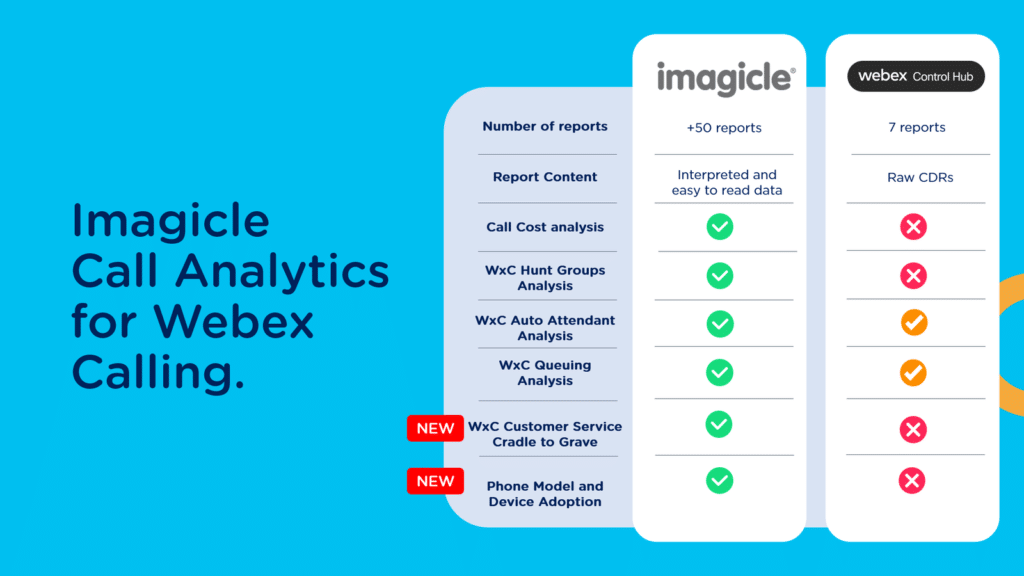
Let’s start with the number of reports. Control Hub offers only 7 reports, while Imagicle Call Analytics provides 50+ reports that group and monitor data, costs, and now even customer service KPIs. You can choose from templates or customize them, extract them in real time, and schedule them via email.
Secondly, Control Hub reports provide raw data that require interpretation and prior knowledge of Webex Calling CDRs and data analysis. Imagicle has simplified this complex matter in Call Analytics, offering rich reports with simple and easy-to-read data easily accessible from the Imagicle UCX Suite portal.
All this was made available a few months ago, when Imagicle announced the native integration of Call Analytics with Webex Calling Multi-Tenant. And now, we’ve further enhanced the solution, and we now have these awesome new reports that give us a chance to really dive into how automatic call management services implemented through Webex Calling Native Call Queues, Auto Attendant, and Hunt Groups are performing. So buckle up and let’s take a look at them together!
Watch a free, customizable demo right now.
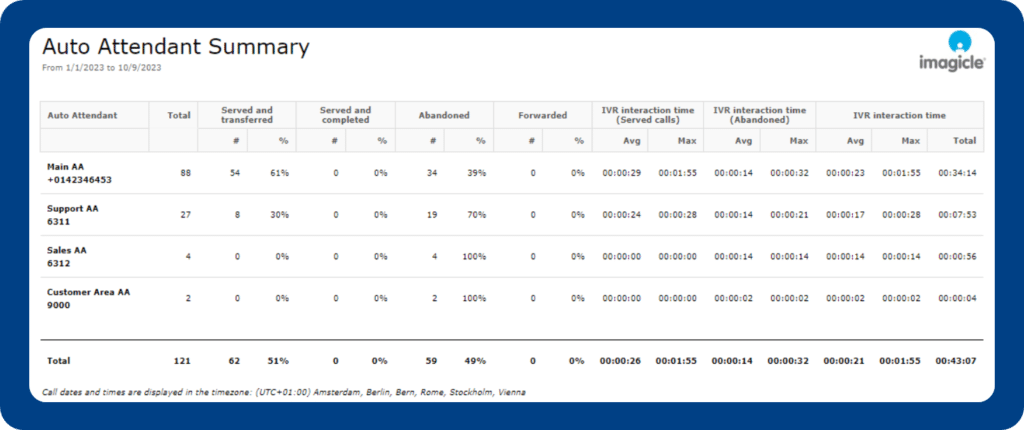
Native Webex Calling Auto Attendants, also known as IVRs, play a crucial role in Customer Service as they are our customers‘ first point of contact. It’s important for us to track various metrics to understand how effective they are.
The Auto Attendant Summary report gives us valuable insights into the number of calls handled by the IVR, including those transferred or abandoned by callers. It also tracks the average, maximum, and total time users spend interacting with the IVR.
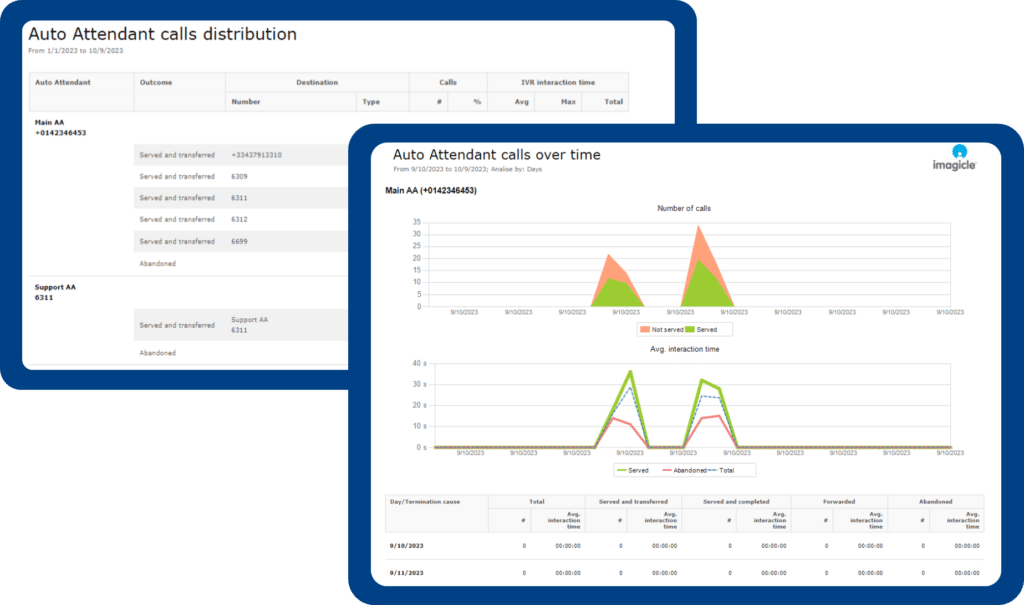
Just like queues, it’s beneficial for an IVR system to capture call routing information. This includes details like the destination number, call type (user, queue, Hunt Group, or another IVR), and the duration of the interaction with the IVR before transfer. Moreover, monitoring the IVR’s activity over time is crucial to understand if a certain destination is not performing well, if there are any technical errors, etc.
By running the Auto Attendant calls distribution and Auto Attendant calls over time reports, we can have a comprehensive understanding of IVR performance and make informed decisions.
In the specified time interval, how many calls were processed by the queue? Of those, how many were handled correctly? How many were abandoned by the callers, and what percentage does that represent compared to the total? The Call Queues Summary report provides a comprehensive overview, presenting the number of calls handled based on their outcome: served, abandoned, overflowed, or transferred by each Webex Calling queue.
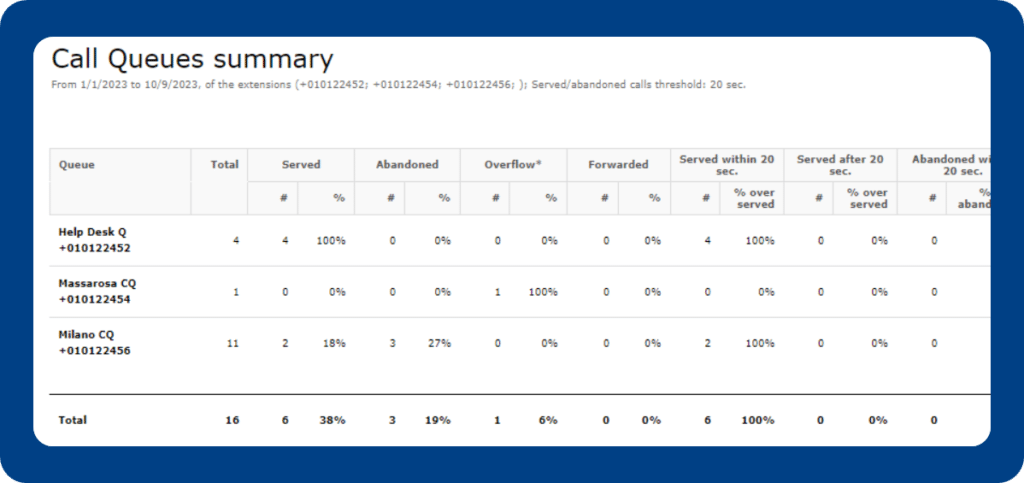
Call Analytics then calculates the average, maximum, and total waiting times for the queues, and additionally allows set a waiting threshold (ranging from 10 seconds to 1 minute), setting a benchmark to analyze the quality of service.
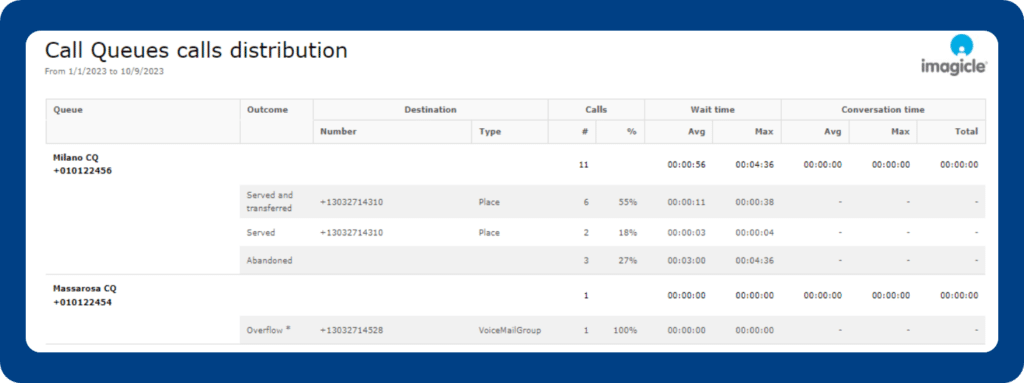
So, what happens after the call leaves the queue? Let’s talk about where outgoing calls are routed from. Ever wondered how many calls each destination handles? And what about the average wait time and talk time of a particular agent on incoming calls from a specific queue? Well, the Call Queues Calls Distribution report has got all the answers for us.
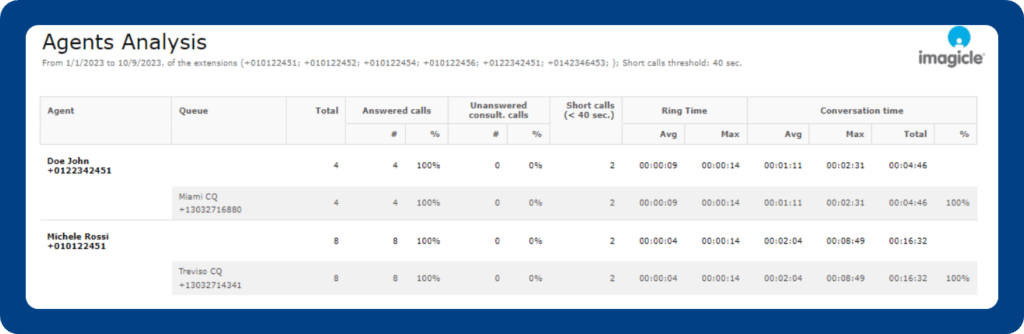
Speaking about agents: how are queue agents performing? Are they losing any calls compared to the ones they handle correctly? And how much time do they usually spend on calls? You can find the answers in the Call Queues Agent Analysis report.
Also, how do queues‘ activity change over time? And how does the number of calls handled by a specific queue evolve? Check out the Call Queues calls over time report for that.
Each report is designed to provide valuable insights into a specific point in the call journey through the queue, giving a holistic analysis of how your company is leveraging this tool. With these reports, you’ll find out if queues are actually making call management faster, or if you need to make some tweaks and reinvestments to help your agents and tools perform better.
One of the pillars that make Call Analytics a pivotal tool for your Webex Calling is native Hunt Group analysis – in fact, the Control Hub tool doesn’t give any insight into native Webex Calling Hunt Groups.
As Imagicle, we provide a specific set of reports to dig into Hunt Groups, starting with the Hunt Group summary report, showing you the best and worst Hunt Groups based on missed calls and the fastest and slowest to answer.
Are you interested about the behavior of a specific Hunt Group destination? Refer to the Hunt Group by extension report.
Are you curious about the busiest hours of the day? Those times when services may struggle and risk missing important calls? Our Hunt Group Busy Hours report has got you covered.
And if you want to dive into the full details of all calls that have passed through the Hunt Groups, you can easily launch the Hunt Group Calls Details report. You even have the flexibility to select only the fields that interest you the most.
Book a free trial now.
Alright, it’s awesome to understand how our services perform, but it’s the overall experience we create for our customers that truly matters.
It rarely happens that a call interacts with one service only. In everyday company life, calls go through numerous Call Queues, multiple Hunt Groups, and definitely more than one Auto Attendant before reaching their resolution.
Traditionally, call tracking reports show you the performance of calls through a certain service on their own – there’s a Hunt Group Report, a Call Queue report, and so on; but they don’t communicate with each other. But, for example, a call might start its journey in your company through an IVR offering a multi-level menu. Then, it gets routed to a queue, or even more queues, or Hunt Groups, all based on which keys the user pressed in the IVR.
And sometimes, it’s even more complicated: imagine a queue that’s full or that surpasses the maximum waiting time. At that point, the call, might fall into yet another queue, IVR, or Hunt Group.
This means that it’s almost impossible to understand the journey of a call, from the moment it enters our services to when it concludes, without mixing and matching reports (hence, wasting time). Questions like How long does a caller stay on hold in total? How many stops does a call make? Did a human agent interact with the caller at any point during the call? And at what stage in our infrastructure is a call abandoned? are left unanswered.
Well, you guessed it: not anymore. The magic lies in our Customer Service Call List, famously known as the cradle-to-grave report. It filters all incoming calls that have passed through at least one queue, a Hunt Group, an IVR, and provides both a concise and an extended version.
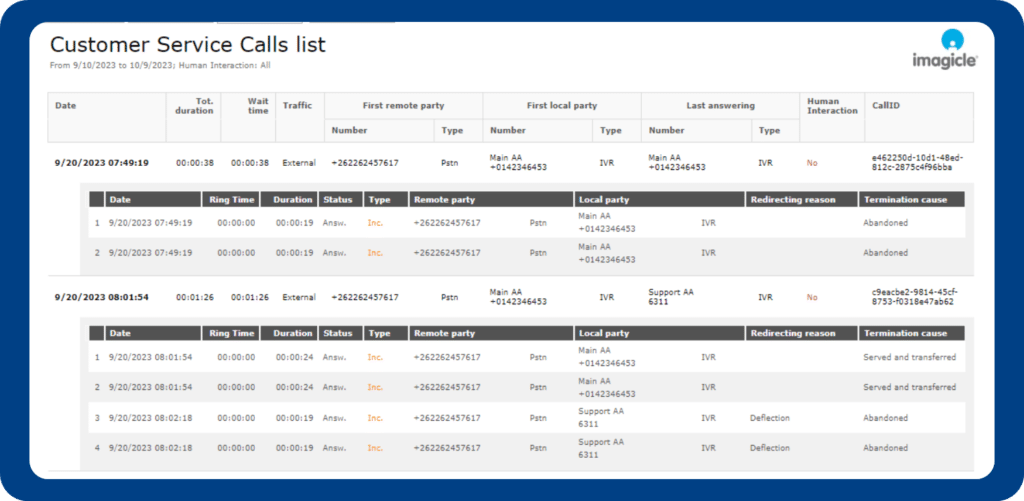
The concise version reveals the last party that interacted with the caller, and whether there was any human operator involvement (this can also be filtered). And for those craving more insights, the extended version showcases every single step of the call, allowing you to easily reconstruct its entire journey through multiple services.
And the best part about all this is that, once you’ve understood holistic customer service performances with this report, you can go back to the specific reports we’ve mentioned above to learn more about specific services involved in the call journey.
If you are curious to know which phone models are most used by your operators, whether these are physical phones or software clients such as the Webex App, now you can! The standard Device Model Adoption and Device Trend Usage reports work perfectly with Webex Calling calls too!
Understanding how your devices are being used is the best way to optimize resources, cut costs, and make decisions that could change your business outcomes for the better.
Customer Service must be kept under control in the best possible way, as it can be both the strength and the weakness of your offer. With Imagicle’s new reports, specific for the services offered by Webex Calling, every detail of the calls is under control.
And of course, don’t even for a second think that Imagicle is done innovating its reporting offer for Webex Calling. These reports will be available shortly (beginning of November’23), but the best stays yet to come, but if you want to have a taste of the present, all you have to do is book a free demo or a free trial – the reports are waiting for you to launch them!
 Entdecken Sie
Entdecken Sie
Entdecken Sie