






 Bernardo Federigi
What Webex Customer Assist does.
Webex Customer Assist gives teams a fast, lightweight way to run customer-facing queues on Webex Calling, without the cost and complexity of a full contact center. Front desks, IT help desks, sales lines and branch offices can route calls to the right people in minutes.
But as soon as queues go live, supervisors ask the same questions. How many callers gave up before we answered? Which hours are we understaffed? Which agents carry the load? Are we hitting our service level?
Native Control Hub reports only answer part of this. They are built for IT administration, not for running a service operation: predefined views, a short analysis window and little room to customize. That gap is where Imagicle Advanced Analytics comes in.
What Customer Assist teams need to see.
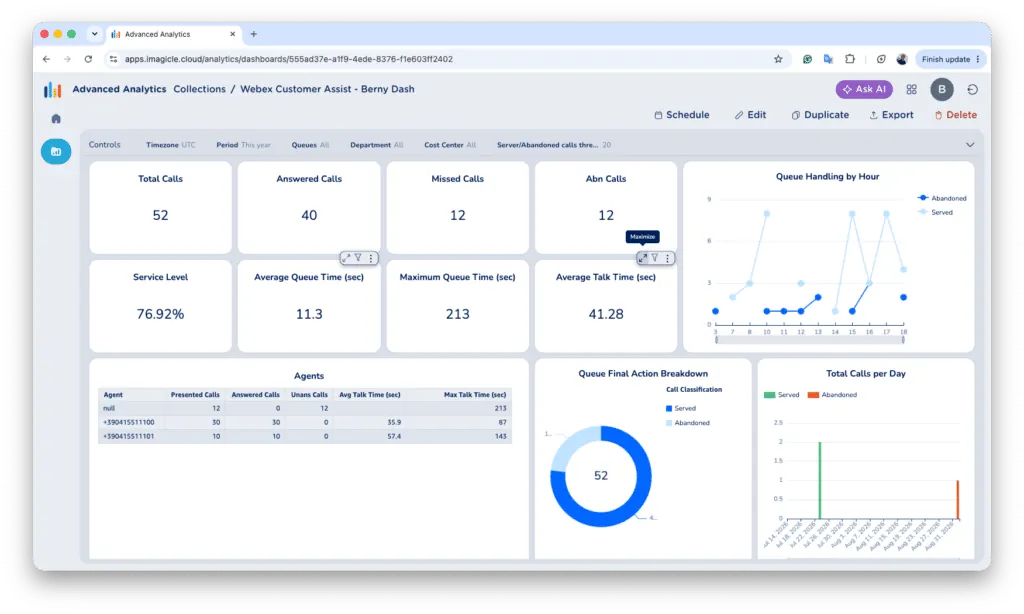
Running a queue well comes down to a handful of numbers, read together and read every day. A ready-made Webex Customer Assist dashboard in Imagicle Advanced Analytics puts them on one screen:
| Area | What you see | The question it answers |
|---|---|---|
| Volume | Total, answered, missed and abandoned calls | How much demand did we have, and how much did we lose? |
| Service level | Service level %, average and maximum queue time | Are callers reached fast enough? |
| Handling | Average talk time, final action breakdown (served vs abandoned) | How is each call resolved? |
| Timing | Queue handling by hour, calls per day, weekly queue activity | When do peaks and drop-offs happen? |
| Agents | Presented, answered and unanswered calls, average and max talk time per agent | Who carries the load, and who needs support? |
Every widget can be filtered by period, timezone, queue, department and cost center. Supervisors can also set their own threshold for abandoned calls, so a „bad day“ is defined by the business, not by a default report.
Beyond Control Hub: how Advanced Analytics fills the gap.
Imagicle Advanced Analytics turns Webex call data into dashboards built for the people who run the service, not only for IT.
| Feature | Imagicle | Webex Control Hub |
|---|---|---|
| Focus | Business and service operations | IT administration |
| Data retention | Up to 7 years | Up to 13 months (Pro Pack) |
| Analysis range | Unlimited | Up to 3 months at a time |
| Dashboards | Fully customizable | Predefined list of widgets |
| Role-based | Full | Minimal |
| AI | Built in, under your control | Basic |
- Dashboards in minutes, not projects. Start from a ready-made Customer Assist dashboard, then adapt it with a drag-and-drop editor or a plain-language prompt. No SQL, no ticket to IT.
- All historical data in one place. Supervisors see agent activity, queue status and service levels, zooming out to weeks, months or years to spot trends.
- Cradle-to-grave call history. Follow each call from the first ring through queue, transfers and final outcome. Ideal for finding routing problems and excessive transfers.
- Reports that reach people. Schedule any dashboard or report by email, hourly to monthly, skip empty reports and export in the format you need.
- Ask AI. Ask questions in natural language, such as „which hour had the most abandoned calls last week?“, and reshape widgets by prompt. AI features can be enabled, limited or turned off at any time.
- One view across platforms. Webex Calling, Webex Contact Center (H1 2027), Cisco UCM and Microsoft Teams in a single tool, with role-based access, audit logs and GDPR-compliant retention.
Related Content
- Communications Analytics in 2026: Why Reports Alone Aren’t Enough.
- 5 Questions Your Communication Data Should Answer Instantly.
- Call Management Software: Find the hidden cost before you renew.
The value for Webex Customer Assist teams.
The real value is contact-center-grade visibility on a Customer Assist budget. Each role gets something concrete.
Supervisors and team leaders.
- Spot abandoned-call spikes by hour and move people to the right shift.
- Compare agents on answered calls and talk time, and coach where it matters.
- Walk into the Monday review with answers instead of exports.
Customer Service and CX leaders.
- Track service level and queue time trends against targets, week after week.
- Prove the impact of changes (new routing, new staffing) with before-and-after data.
- Turn missed calls into a measurable recovery list, not lost customers.
IT and voice teams.
- Stop building custom reports on request: business users serve themselves.
- Keep years of data instead of months, with role-based access and audit logs.
- Cover Webex, Cisco UCM and Teams with one tool during migrations.
Executives.
- See if Customer Assist is enough, or when a more advanced solution is justified, based on real demand data.
- Keep communication costs under control: Imagicle reports up to 30% savings on communication costs.
Conclusions.
Webex Customer Assist makes it easy to put customer-facing queues on Webex Calling. Imagicle Advanced Analytics makes sure you know how well they perform: every missed call, every peak hour, every agent, over years and not just weeks.
See it on your own data. Get your 30-day free trial or book a live demo of the Webex Customer Assist dashboard.